
Affiliate Marketing
October 15, 2026
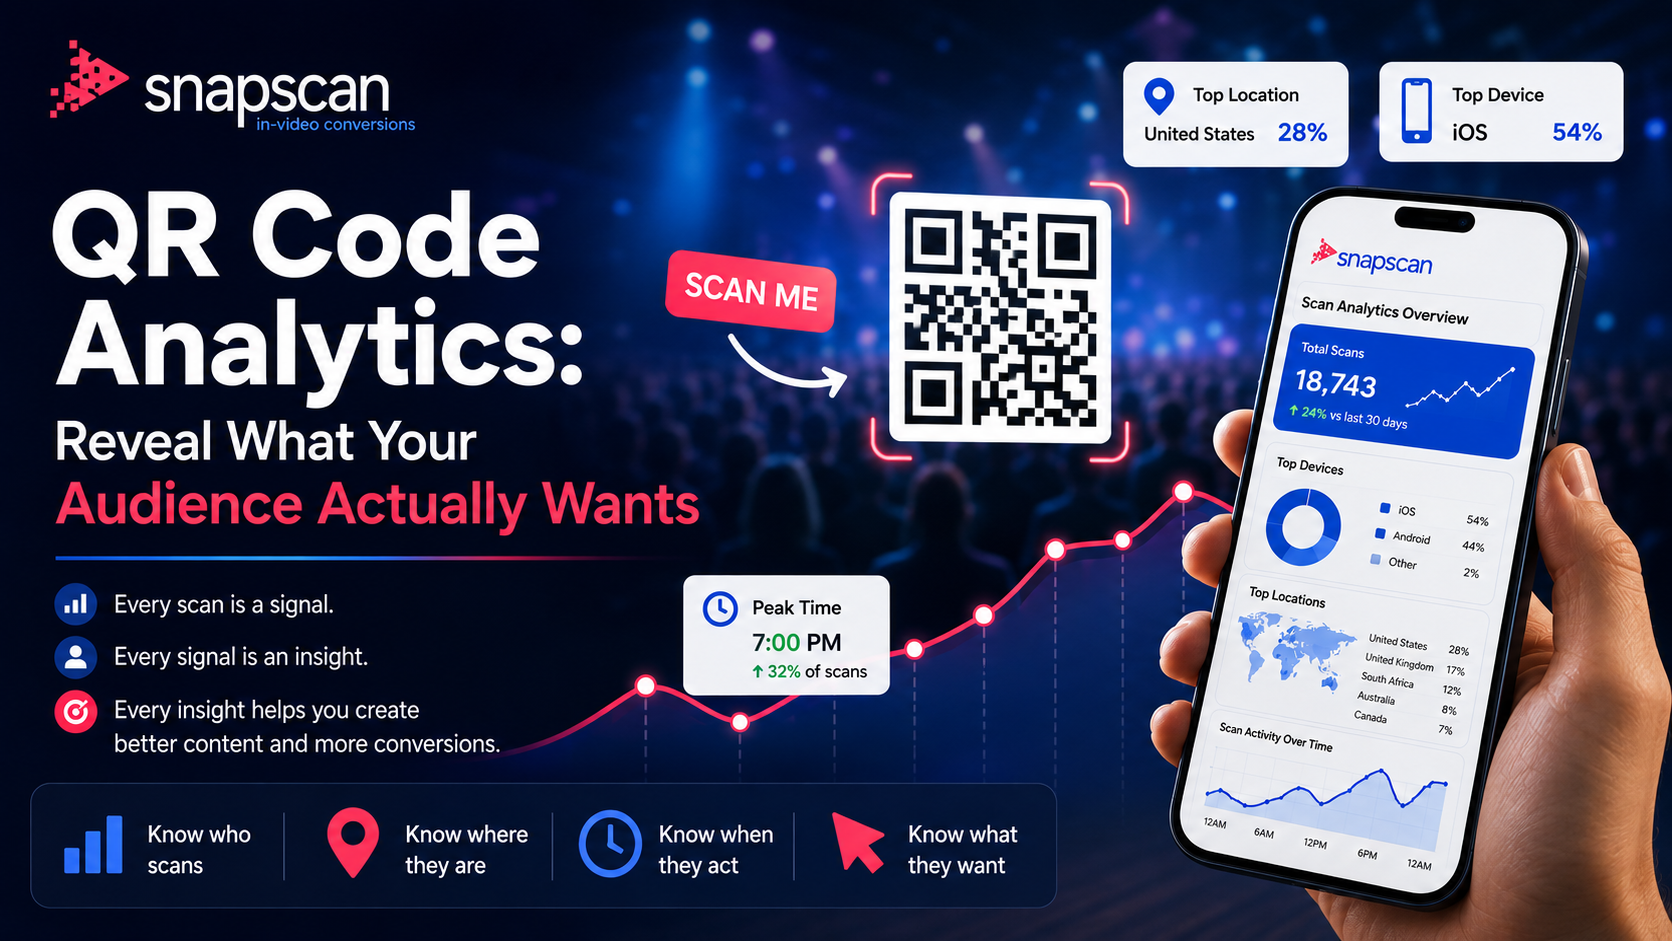
Short-form content creates moments of intent. Someone sees a product, service, property, course, event, or offer and wants to know more. The problem is what happens next. Traditional funnels often ask that viewer to leave the content, visit a profile, find a bio link, search through destinations, and then take action.
Every extra step increases the distance between desire and action. An in-video QR code shortens that journey, and the scan creates something views alone cannot: a measurable action signal.
|
Views tell you who showed up. Scans tell you who cared. |

A trackable dynamic QR code can turn each scan into a useful analytics event instead of a simple tally.
How many scan events the content generated.
Separate distinct scanners from total interaction volume.
See device and operating-system patterns that can inform destination testing.
Understand where measurable scan activity is coming from.
See when people act, not only when they watch.
Connect scan activity back to a specific QR asset, destination and campaign.

With SnapScan, the QR code inside your video becomes a measurable connection between a specific piece of content and the action it generated. Platform analytics tell you how much attention a video received; SnapScan adds a second layer that shows which content generated scan activity.
Read the SnapScan Analytics Dashboard Walkthrough or the Scan Activity & User Engagement guide for more detail.
Raw scan totals can favor the video with the biggest audience. Scan rate gives you a better way to compare action efficiency.
|
Scan Rate = Unique Scans ÷ Video Views × 100 |
Video A: 100,000 views → 500 unique scans → 0.5% scan rate
Video B: 25,000 views → 500 unique scans → 2.0% scan rate
Both generated the same number of unique scanners, but Video B did it from one quarter of the views. Its scan rate was 4× higher. That does not automatically make it the better video, but if your goal is to drive action, it tells you which content converted attention into scan intent more efficiently.

QR scan analytics complement platform metrics by adding evidence of who took the next measurable action and which asset generated it. That makes them useful for creators and marketers who want to measure more than reach.
Related: Why 'Link in Bio' Is a Conversion Bottleneck and How to Increase Video Conversions Without Using Link in Bio.
Use device patterns to prioritize landing-page and checkout testing.
See where measurable action is coming from, not just where content is viewed.
Compare scan timestamps with posting and promotion windows.
Rank similar content by unique scans and scan rate, not views alone.
Unique scans estimate distinct scanners. Total scans measure total scan events. Track both and do not use total scans as a substitute for distinct reach.
|
Views → Unique Scans → Destination Visits → Conversions → Revenue |
Views: Did people see the content?
Unique scans: Did the content create enough interest for someone to take a measurable scan action?
Destination visits: Did they continue after scanning?
Conversions: Did they complete the intended action?
Revenue: What was that action worth?
A scan is not automatically a sale. It is the first measurable action in the path. Downstream conversion tracking is what connects that action to what happened next.

The value of analytics is the feedback loop: publish, capture scan data, compare results, adjust, and post again. Over time, repeated patterns can help you identify which formats, offers, CTAs and QR implementations consistently generate stronger action.

There is no universal benchmark. Compare your own similar videos over time using unique scans ÷ views.
No. A scan is a measurable action. Conversion tracking is what shows what happened after the scan.
Repeat activity can happen when a person scans again or returns to the destination. Report unique and total scans separately.
Step-by-step guides: How to Scan a QR Code from a Video
SnapScan shortens the path between desire and action by putting the destination directly inside the content and adding the analytics layer to understand the scan activity that follows.
See which videos make people act, not just watch. Start with SnapScan
October 15, 2026
October 5, 2026
September 25, 2026